Description and comments
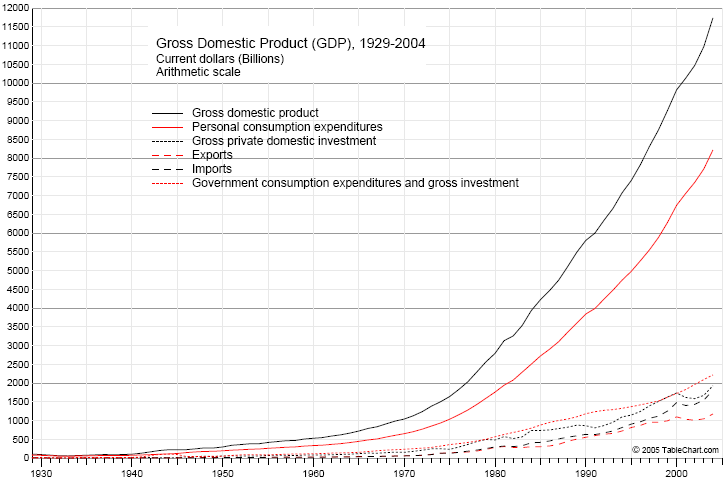
The Gross Domestic Product is a measure of the value of economic production.
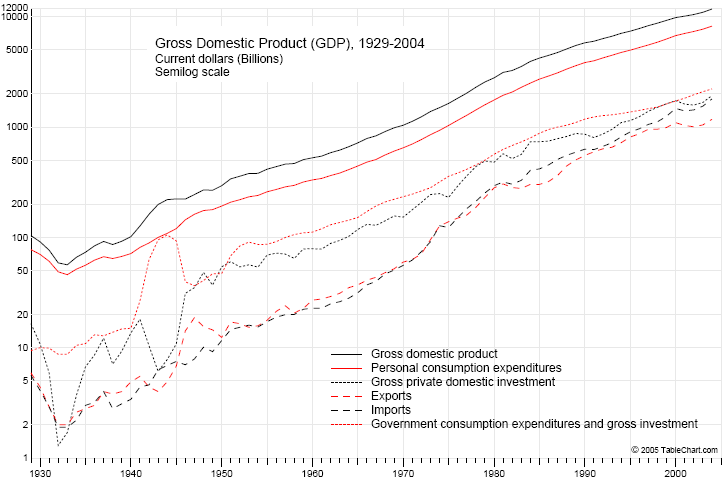
The semilog scale used in the top chart above is better for displaying growth processes such as the US economy over time. The fact that the lines are fairly straight after the Great Depression shows that economic growth has been fairly steady.
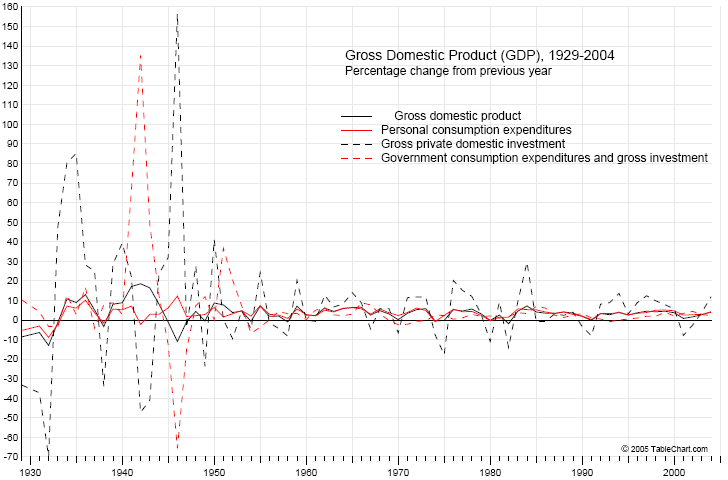
In the percentage change chart, note the high variation during the Great Depression and WWII periods. After that, the percentage changes are smaller, but usually above zero, enough for substantial growth over time.