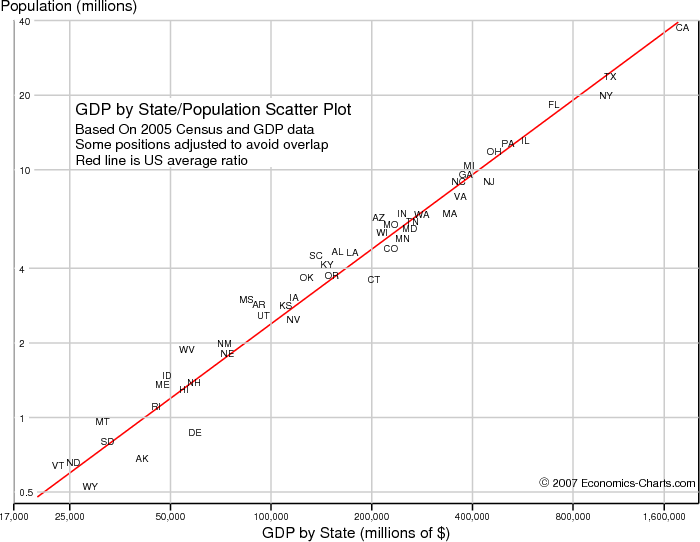
Top Chart: 2005 GDP and Population
In the top chart, the name (Postal ID) of each state is placed on the chart where its 2005 GDP and population values intersect. In some cases the positions have been shifted a little bit so that the names don’t overlap. The red line shows the US average for 2005, which works out to $41,852 GDP per capita.
The farther below and to the right of the average, the better, in terms of economic productivity. Position with respect toward the upper right and lower left is mostly just due to population size.
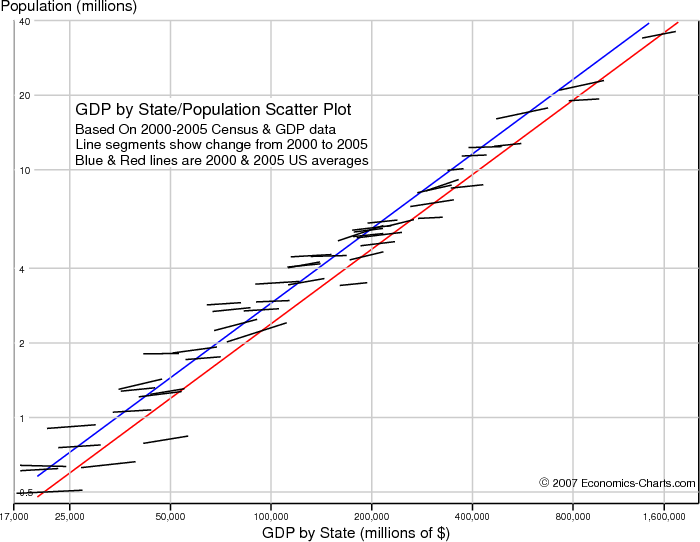
Bottom Chart: 2000-2005 Change in GDP and Population
In the bottom chart a short line is drawn between the 2000 values and the 2005 values. The blue line shows the US average for 2000, which is $34,545 GDP per capita. The state names are omitted because they would lie on top of the lines and make the chart unreadable.
You would like your state’s line to be long and the slope to be low (winding up relatively closer to the lower right corner).
To be honest, this chart is pretty obscure, and I only include it because it was easy to make once I had the top chart set up.